
Analytics TV brings your traffic, search performance, reader behavior and revenue into one dashboard, built for people who run websites, not analytics software. Here’s what’s actually inside.
Traffic and trends
See visitors, sessions, pageviews and how today compares with an earlier period, for one site or your whole portfolio. When something changes, the first question is always the same: which pages moved? Analytics TV ranks your top pages by traffic and by change, so a spike or a drop points straight at the page causing it.
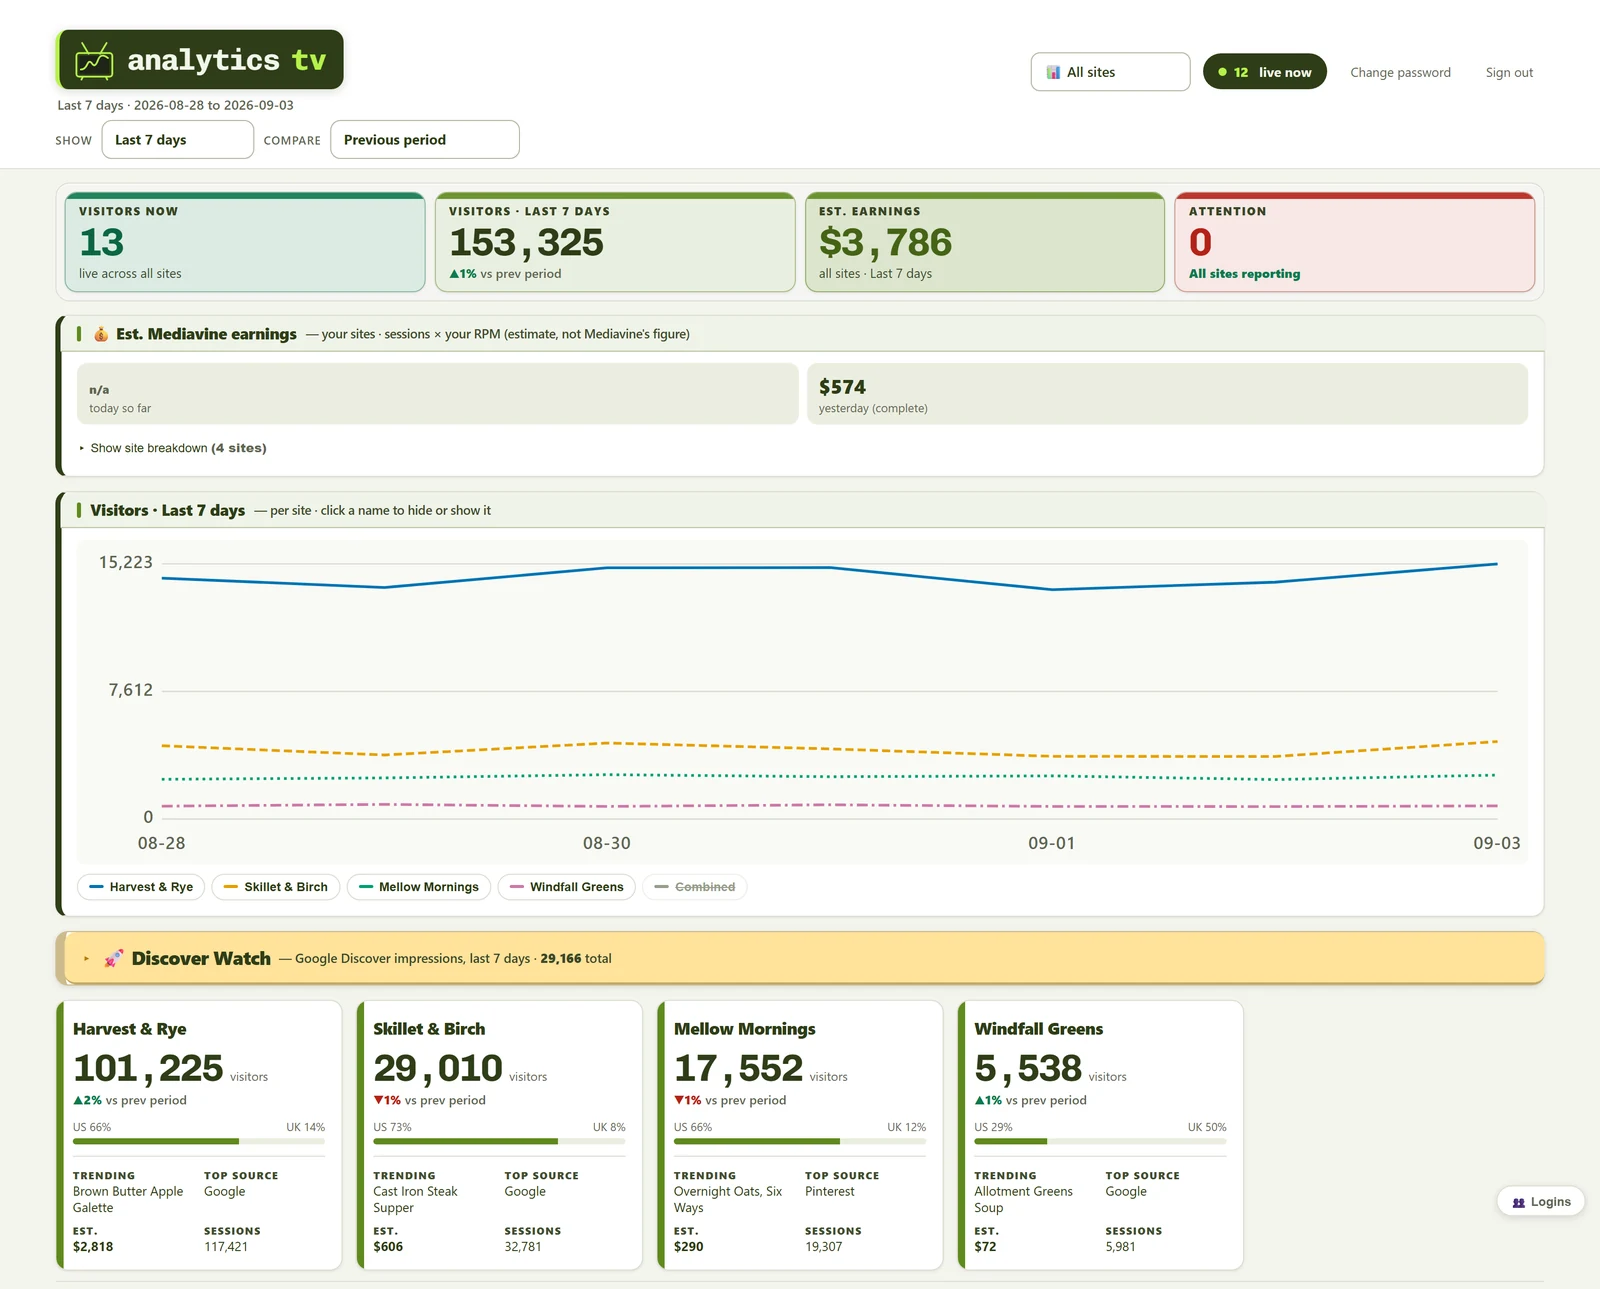
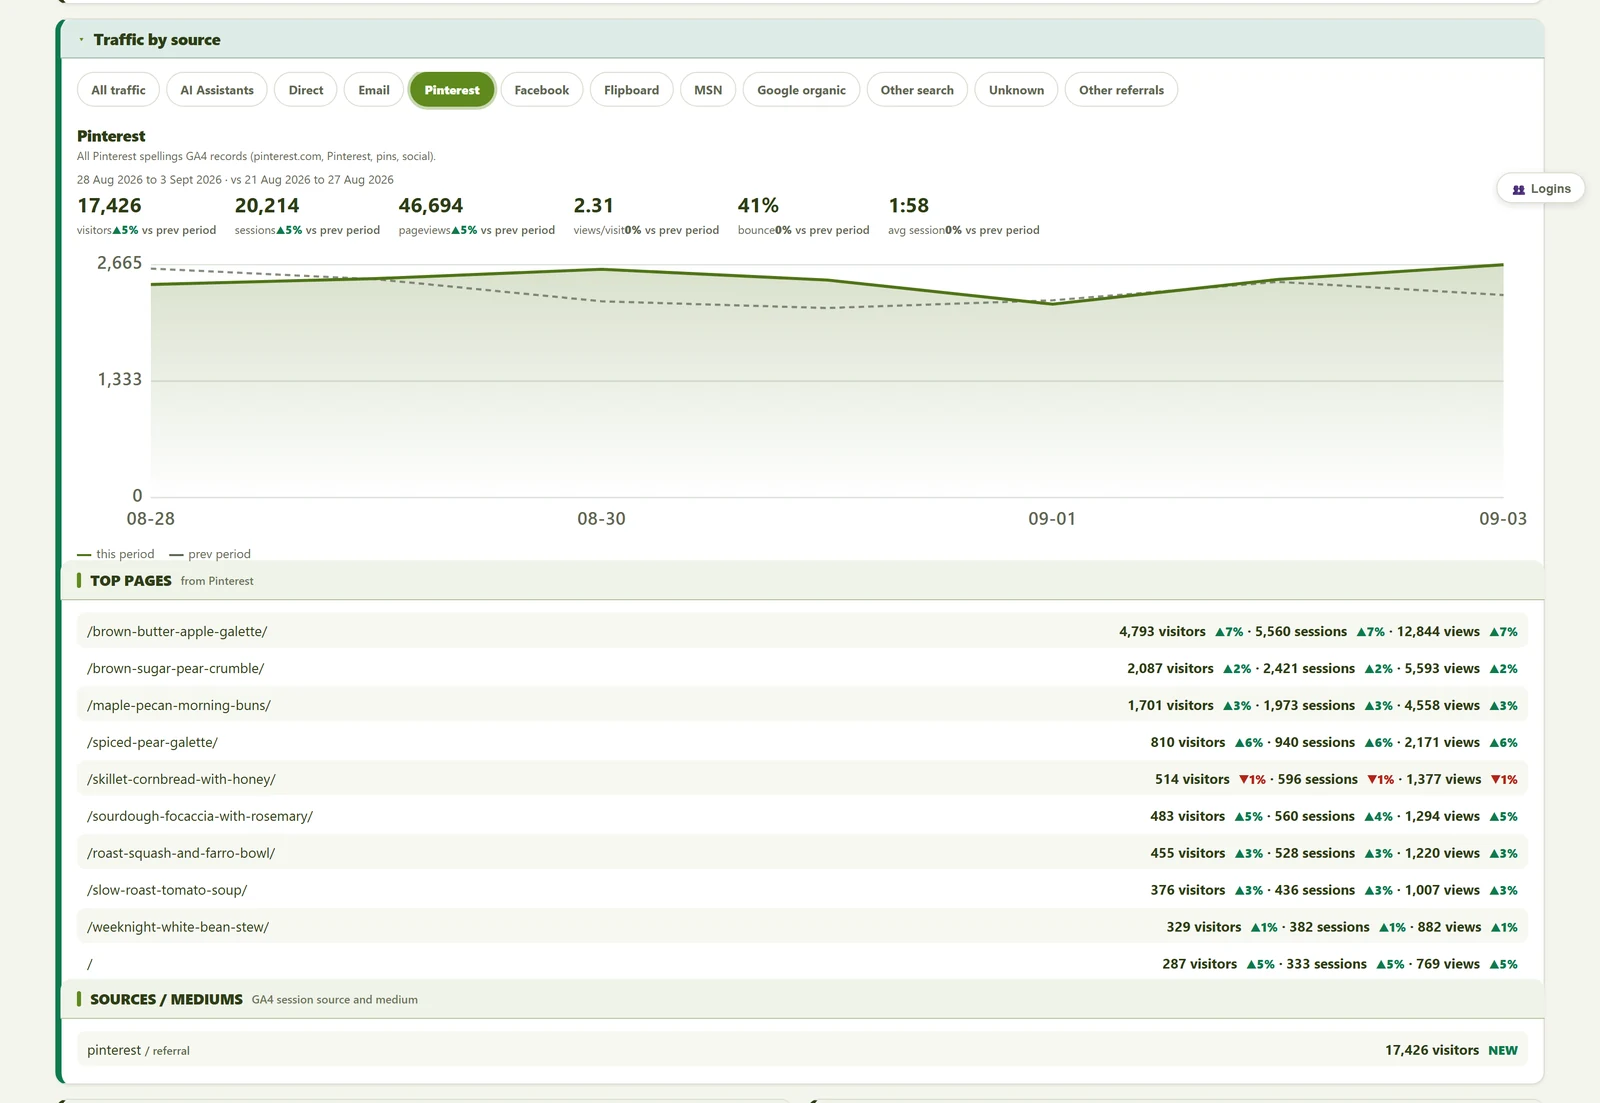
Where your traffic actually comes from
Every visit is tagged by source: Google organic, Pinterest, direct, email, and traffic from AI assistants like ChatGPT and Perplexity. View traffic as a whole or filter the view to a specific source or channel (including Google organic, Pinterest, email, AI Assistants and Direct), so you can see whether a change is coming from somewhere familiar or somewhere new, like an AI answer sending readers your way. Analytics TV counts the well-known AI assistants that identify themselves and groups them into their own channel; an assistant that doesn’t identify itself can’t be told apart from direct traffic, and the panel says so rather than guessing.
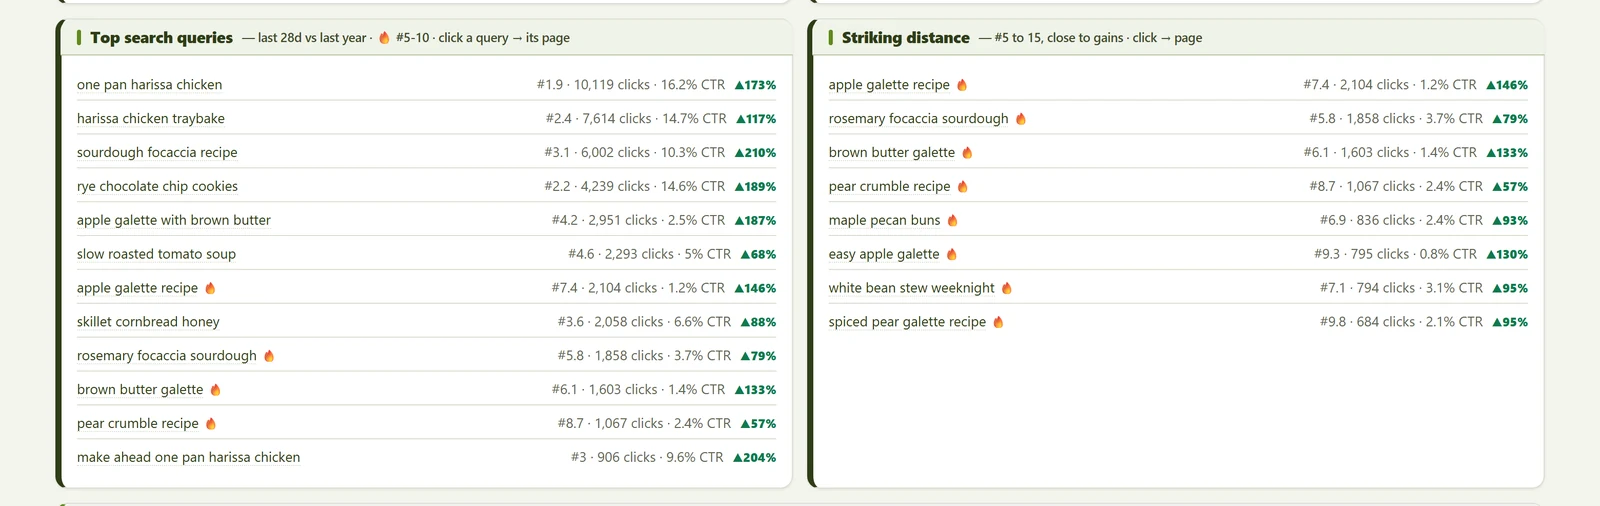
Google Search performance
See the queries actually bringing people to your site, their ranking position, clicks and click-through rate, compared with the same period last year. Analytics TV also flags queries sitting just outside page one, close to a ranking gain, so you know where the next win is most likely to come from. Click a query to jump straight to the page it’s driving traffic to.
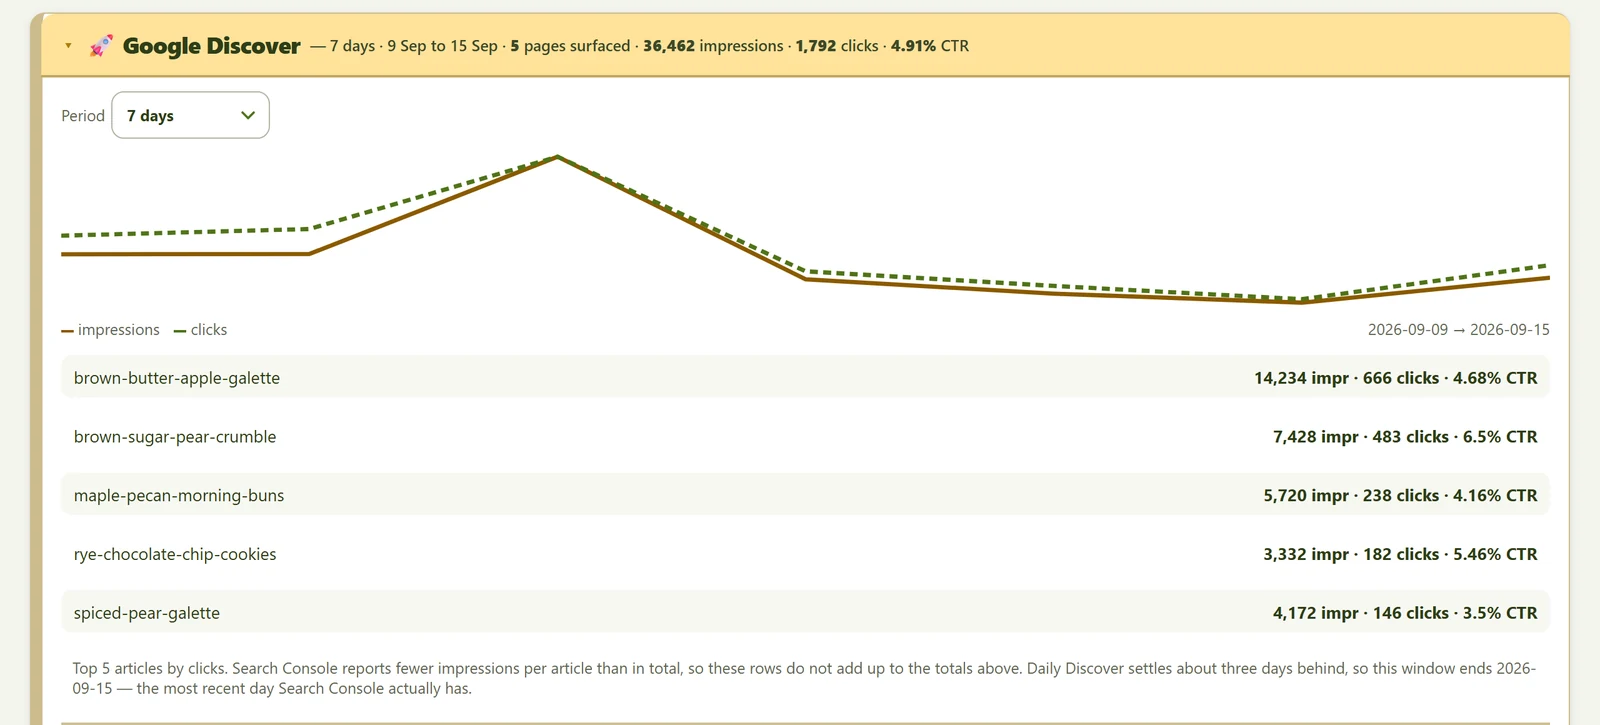
Google Discover
Track Discover impressions and clicks over time, for one site or across your whole portfolio, so you can see when Discover is picking up new content, and when it goes quiet.
Reader behavior and journeys
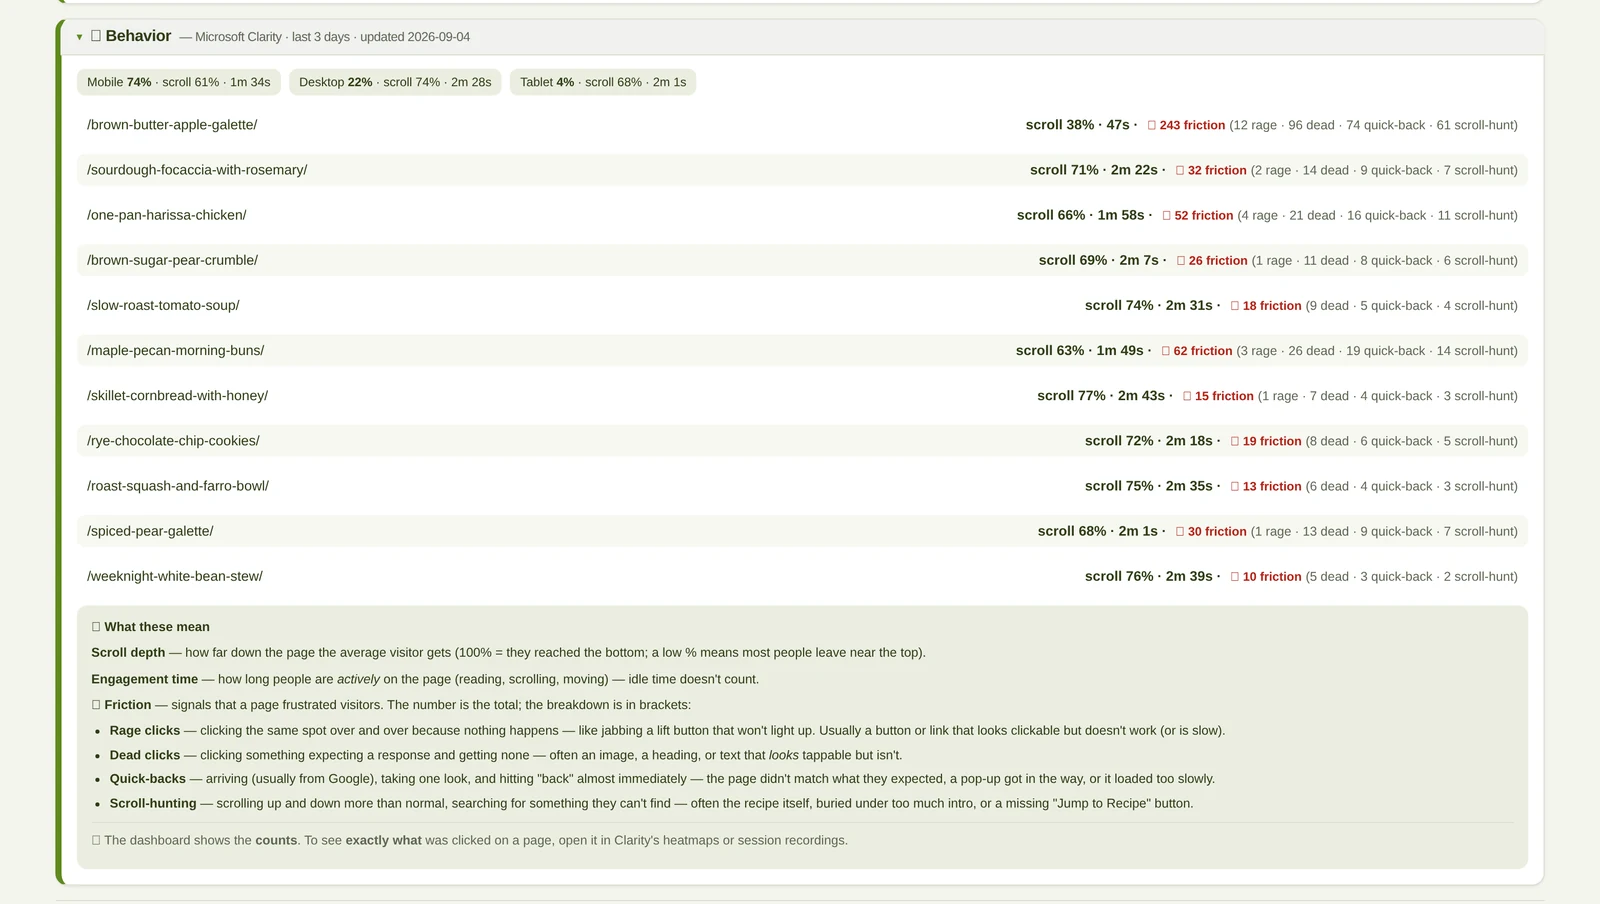
See where visitors go after they land: which page they move to next, and which pages they leave from. Analytics TV also surfaces friction, such as pages where people scroll and bounce back, or click without anything happening, so you can see where a page is frustrating readers rather than just guessing.
This uses your own Microsoft Clarity project, connected using credentials configured for that Clarity project, where you’ve enabled it. It is not a separate tracking script Analytics TV installs.
Revenue estimates
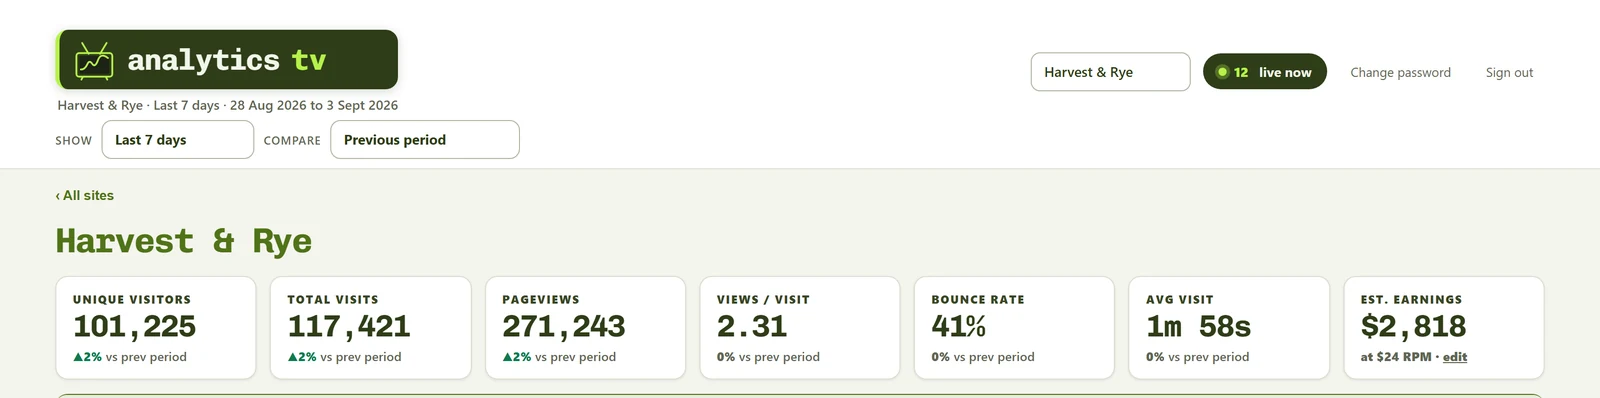
Use your own RPM to estimate earnings alongside traffic, so a change in visitors is always shown next to what it’s likely worth, today, not weeks from now. See today’s estimate against yesterday’s completed total, for one site or your whole portfolio.
Newsletter and audience
If you run your newsletter on Kit, connect it with an API key and it sits alongside everything else: subscriber count and net growth, open and click rates, and every recent send ranked by the clicks it earned. Analytics TV also surfaces the parts that are easy to miss: which subject lines beat your own average and which quietly cost you subscribers, when your list actually opens, which lead magnets are bringing people in, and whether an automation has stopped doing its job.
Earnings shown against a send are an estimate worked out from clicks and the RPM you provide, not a figure read from an ad network. And because your newsletter data sits in the same place as your traffic and search data, you can ask about it in plain English: the question at the end of the clip below was answered from this account’s own send history, with its sources listed underneath.
Ask questions about your own data
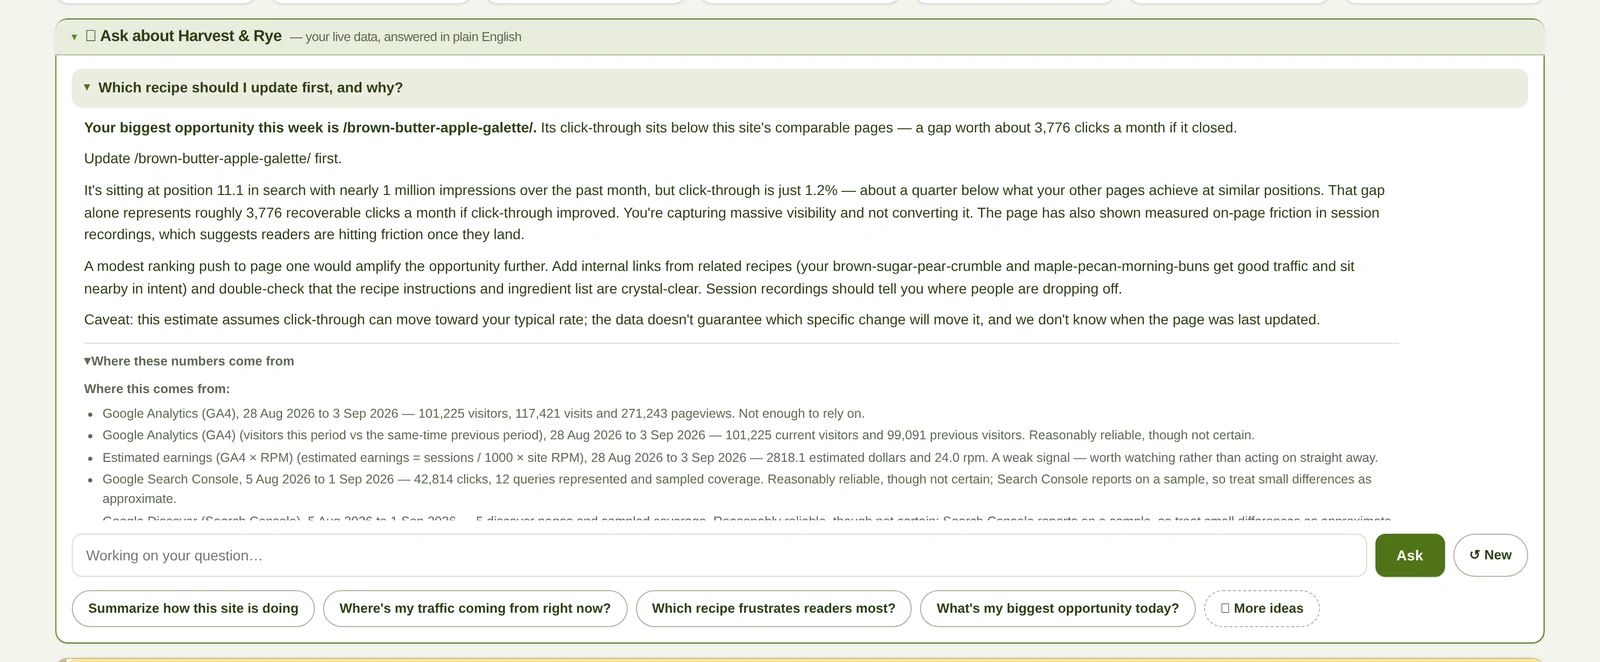
Type a plain-English question (why is my bounce rate high, where’s my traffic coming from right now, which page is losing readers) and get an answer written from your own live data, not a generic explanation. When an answer draws on your data, its sources are listed underneath: which systems the figures came from, the dates they cover, and how far that evidence can be trusted, in plain words. Analytics TV writes that list itself. The AI explains what the numbers mean, and cannot choose, add, or invent a source of its own. When the evidence is weak, it says so, rather than dressing a thin signal up as a firm answer.
Give your team access without giving away everything
Access is scoped per person, not all-or-nothing. Give a newsletter VA the sites they support so they can see what’s working, what isn’t, and Analytics TV’s recommendations, without ever seeing what those sites earn. Give an SEO or content VA the same for search and traffic. An editor gets exactly the sites and data they need, not a window into your revenue or the rest of your portfolio. Revenue can stay visible to you alone, no matter how many people are working inside Analytics TV.
See what this looks like on your own sites.